
 GISLightning
Know which of your structures lightning will hit, before the season.
- plotted on the live map, beside the fires
- Every strike
- plotted on the live map, beside the fires
- of strike records behind every density map
- Years
- of strike records behind every density map
- a written report before the season
- Per site
- a written report before the season
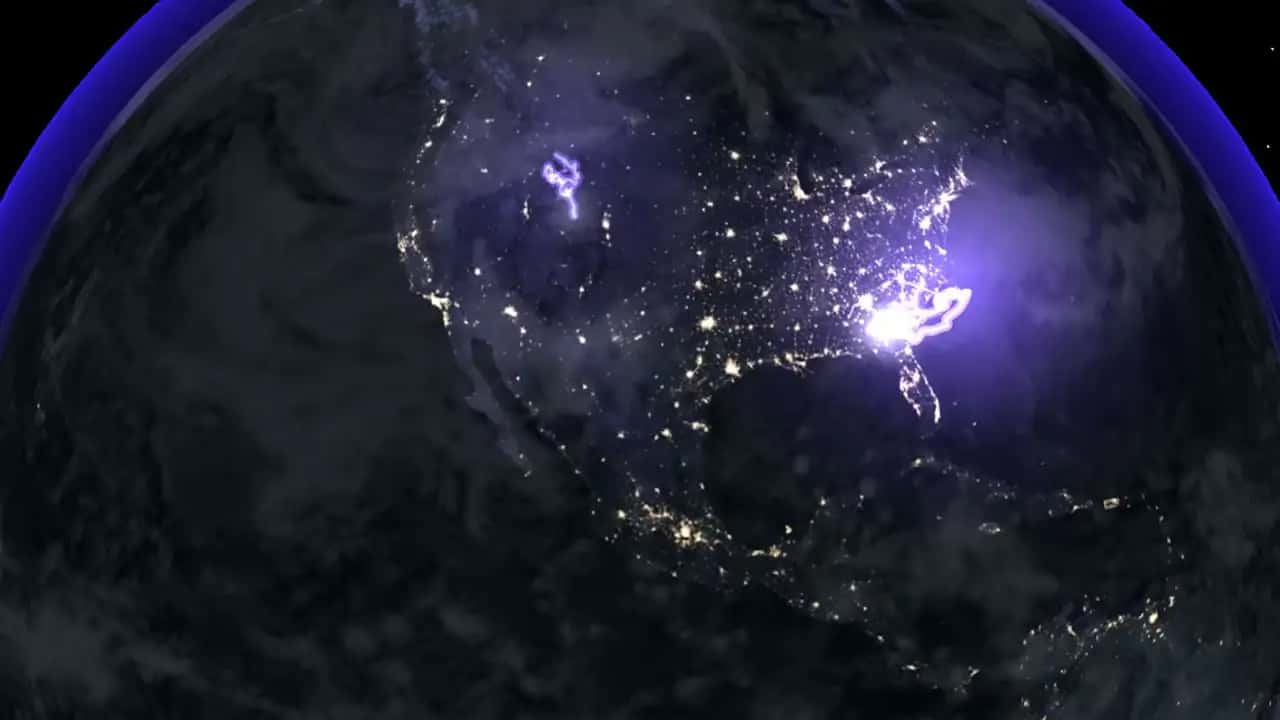
What it does
GISLightning maps where strikes cluster around your site, from years of strike records, and scores the exposure of each structure: masts, lines, tanks, roofs. The deliverable is a written assessment per site, quoted on request and delivered before the season, so the protection budget is decided on evidence.
A web application is in development; today the product is the assessment itself, produced with the same GIS pipeline as the rest of the platform and plotted on the same live map as the fires.
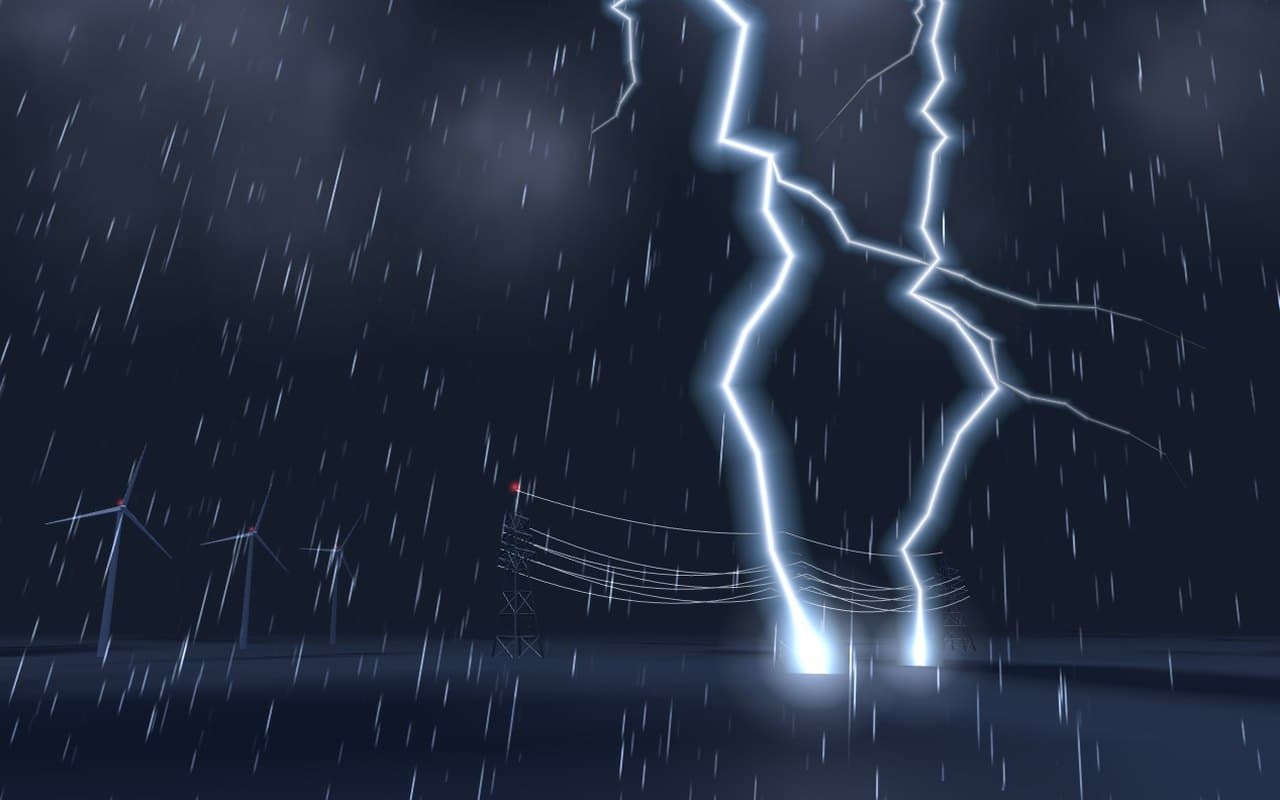
- Strike density around your site, from years of records
- Exposure of each structure: masts, lines, tanks, roofs
- A written assessment, delivered before the season
Who it serves
- Energy and grid operators
- Telecom tower owners
- Industrial and storage sites
- Airports, ports and logistics hubs
- Event venues and open-air sites
- Insurers and risk engineers
The science behind it
Every density map is computed from years of recorded strikes around your coordinates, never extrapolated from national averages: the difference between a real spatial analysis and an actuarial guess is the whole value of the assessment.
The method sits on the same published geospatial pipeline as the rest of the platform: collection, unified base, exposure scoring per structure, and a written report a risk engineer can audit line by line.
All products
 The high-fidelity 3D twin of your territory, under every application.Discover
 GISFloodFlood simulation of your site, street by street, before the storm.Discover
 GISFireEvery active fire, live. Alerts on the zones you protect.Discover
 GISSpaceSpace weather and orbital traffic, live on one globe.Discover